Notification Event Analytics
Fyno's Notification Event Analytics allows you to visualise the performance as well as gain insights into your Notification Events in the form of graphs and charts in one place, which helps improve the overall experience as well as outcomes pertaining to that notification event.
To get started with Notification Event Analytics, you will need to have created a Notification Event. Once a Notification Event is created and is in use, the triggered notifications would be summarised into the Analytics.
You can find your way to Notification Event Analytics by:
- Navigating to the Notification Events page and clicking the "Bar Chart" icon on the top right corner of the corresponding event card.
- By clicking on a Notification Event and clicking on the "Bar Chart" icon on the top right corner of the event.
On clicking on the "Bar Chart" icon for Notification Event Analytics, a new page opens up with details. For ease of understanding, an Notification Events Analytics page with pre-populated data is visualised below.
Time Filter
At the top right corner of the page, you will see options to filter the analytics by a time period of your choice:
- Today
- Yesterday
- Last 7 days
- Last 28 days
- Custom ( Allows you to set a time range up to the last 3 months)
The selected filter will apply to the entire Notification Event Analytics report page, globally.
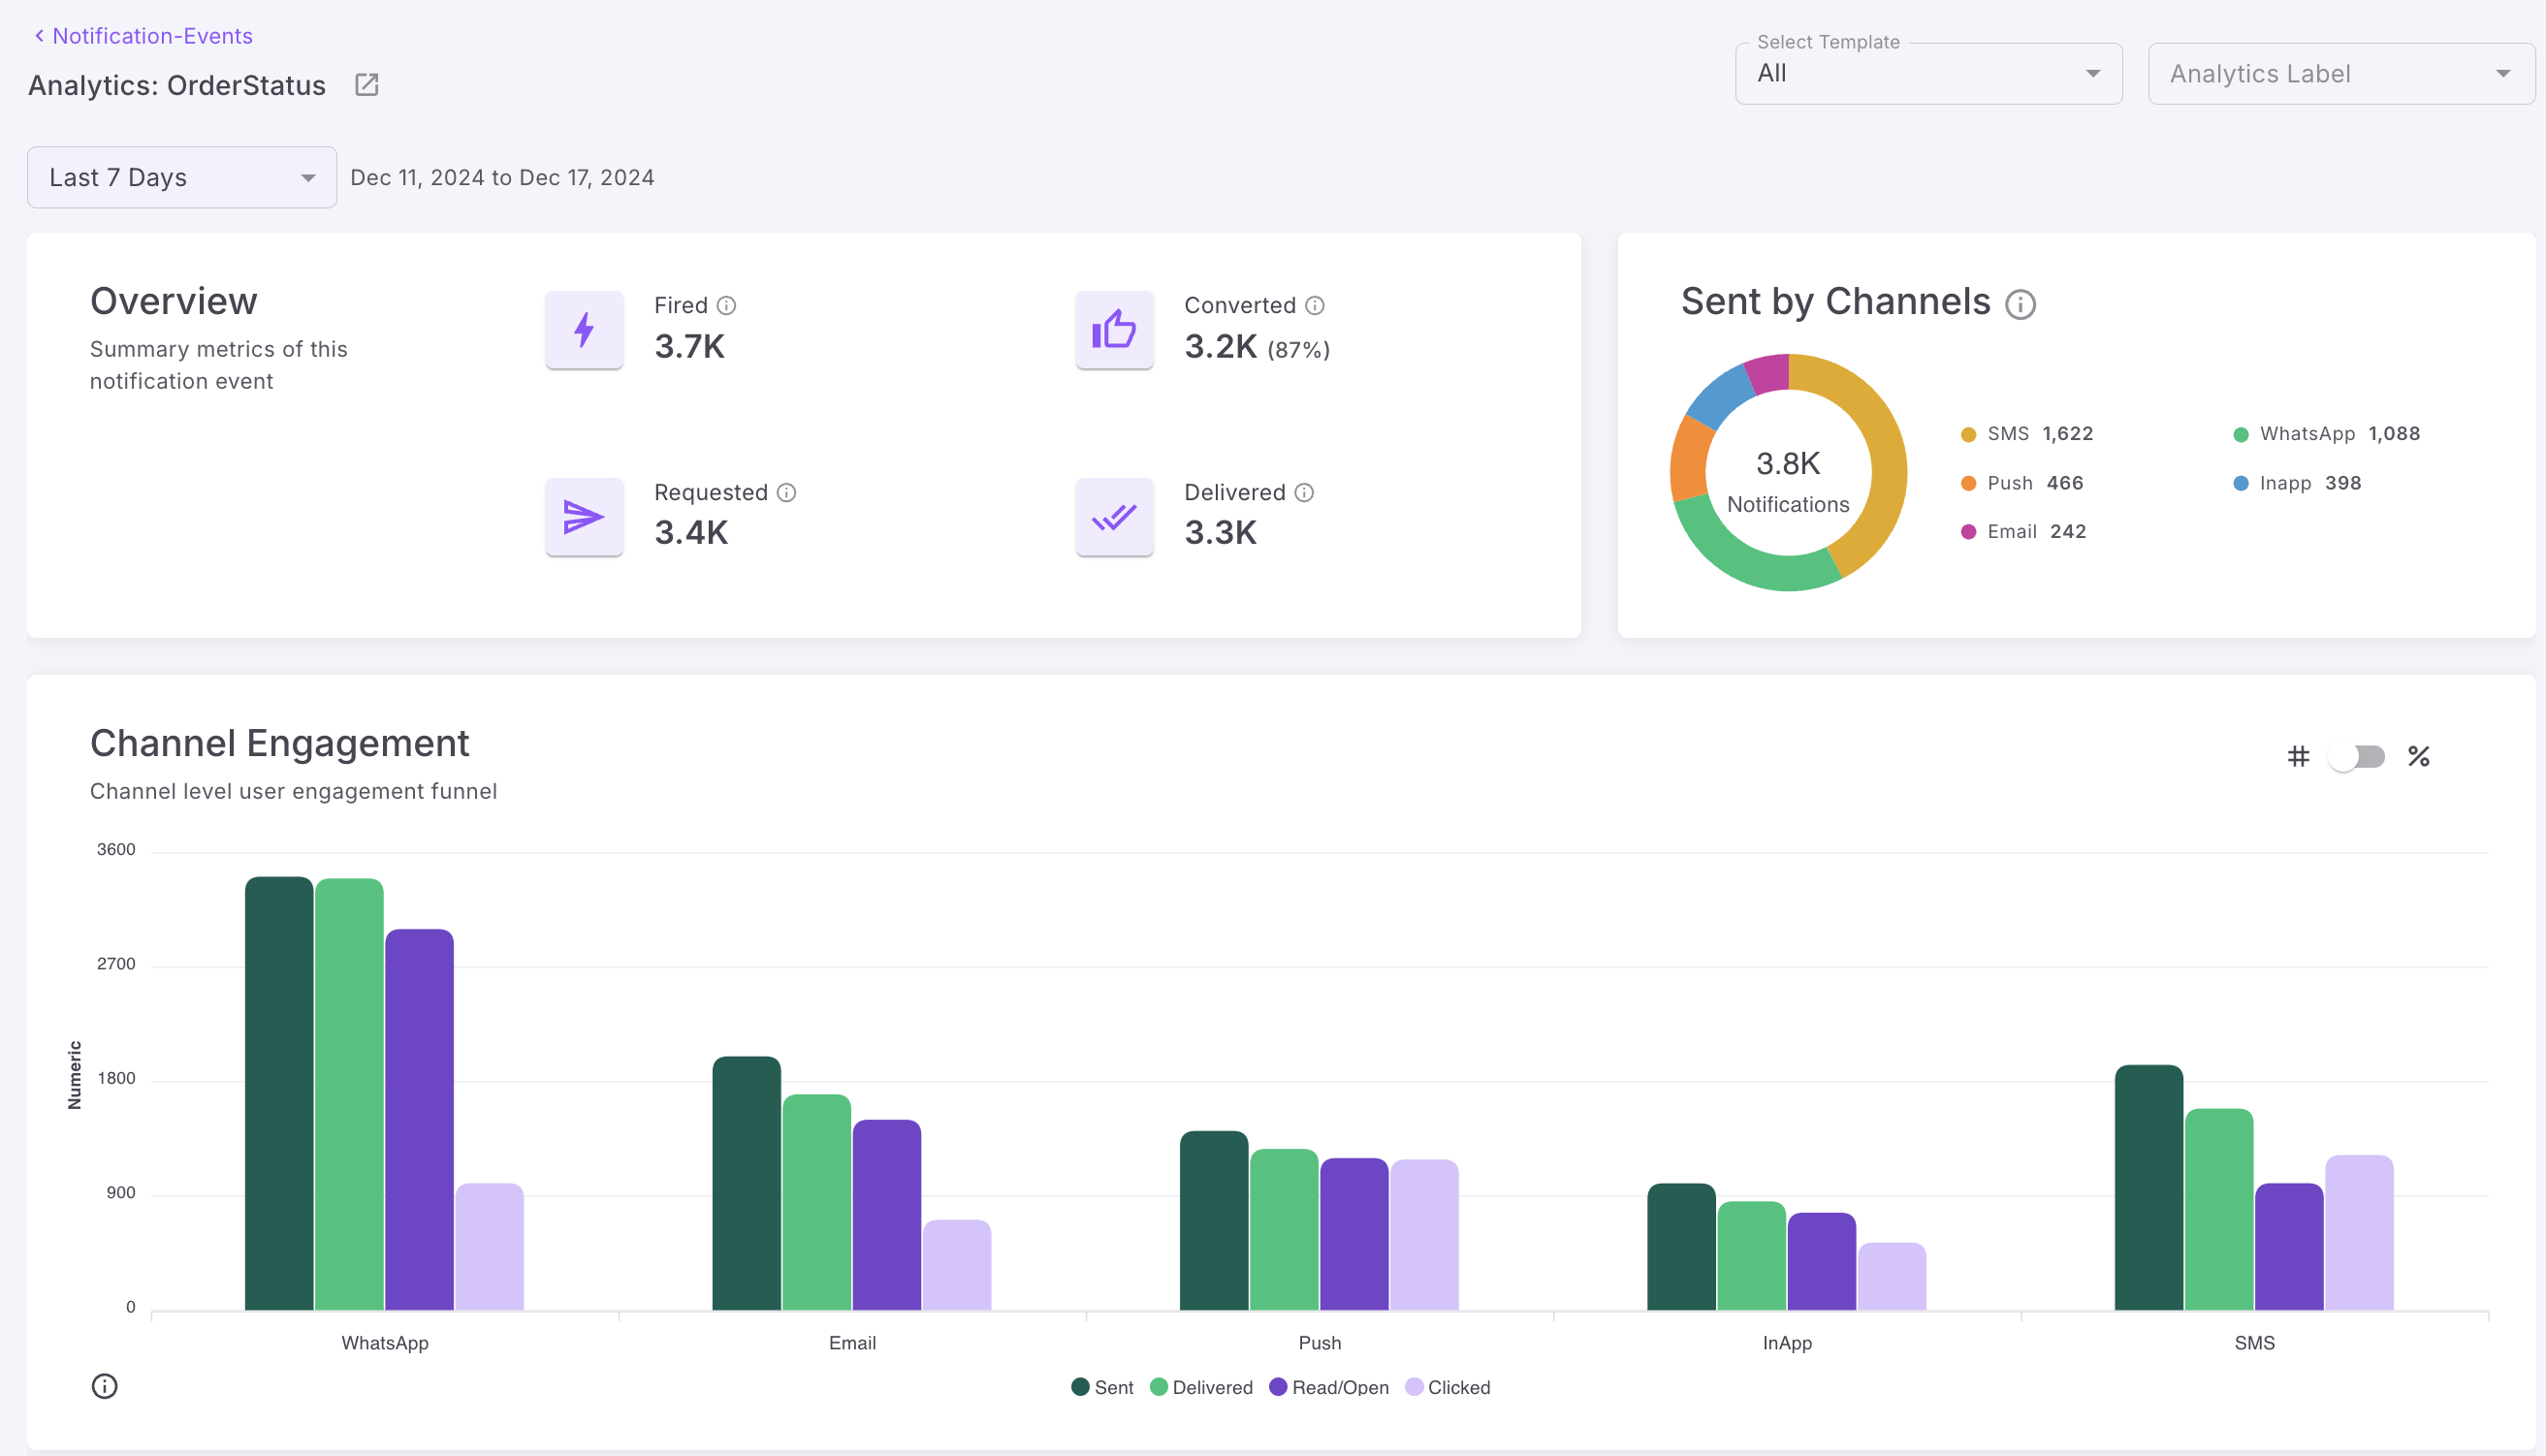
Overview
The Overview section of the Notification Event Analytics section provides an eagle-eye view of the event's performance.
On this card, you will see:
- The number of times the notification event was fired
- The number of notifications submitted via this notification event
- The number of notifications delivered via this notification event.
- The no of conversions for this notification event (if you have enabled Track Conversion in your notification event). You can read more about it here.
Count of notifications higher than number of times the notification event was fired?
Thats completely normal! It all depends on the number of channels and providers added for the route or notification event itself.
In case you have more than 1 channel or provider configured, you will have exponentially more number of notifications, compared to the number of times the notification event was triggered.
Sent by Channels
The Channel Sent card gives you a view of the distribution of notification traffic through the channels used.
Analytics Label
The Analytics Label filter enables you to view analytics based on Dynamic Analytics label you configured in your notification event. You can read more about it here.
Channel Engagement
Channel Engagement provides you with a detailed view of each channel used to send out notifications along with the outcomes of the notifications sent.
Outcomes can be anything from:
- Sent - When a notification is successfully sent from Fyno's platform
- Delivered - When a notification gets successfully delivered to the destination (mobile number, email address, or device tokens like in the case of Push).
- Read/Open - Read applies only to WhatsApp and In-App notifications. When any of these notifications are interacted with or opened, the provider returns a status as "Read" for all of these notifications. Whereas, Open applies only to email notifications. When an email is essentially "opened", this will be tagged as "Open" and tracked on Fyno's App.
- Clicked - When a notification is clicked on, this will be tracked as a "Clicked" notification. This applies to In-App, Push, Emails with links, etc.
- Deleted - When a Push notification is rendered in user's device and user dismiss it by swiping left.
- Keypress - When a user receives a voice IVR call and presses a key to proceed with the call.
- Replied - When a user replies to a WhatsApp a notification he/she receives in their device.
You can read about all the different notification statuses for each channel here
The count for each can be seen on hovering over the bar graphs.
You can highlight a single status to look at!
Simply click on the other statuses from the legend list at the bottom of the graph to un-select them!
Delivery Status
The delivery status graph shows you the delivery status by the channel that you have selected from the drop-down in the top right corner of the card.
The list will populate the Channels based on usage and in chronological order of the count of each channel.
You can toggle on or off the statuses you would like to see by clicking on the legends at the bottom of the graph. Let's have a look at some of these statuses to understand it better.
- Sent - All notifications that have left the Fyno App successfully towards the destination are marked as "Sent". In scenarios where there is no delivery confirmation received from the provider, this status will remain as "Sent".
- Delivered - When a notification is delivered successfully to the Destination, then these messages are considered "Delivered"
- Error - All notifications that fail to be triggered from the Fyno App due to some error (it may be any from an issue on a template to not choosing a provider for a channel), will be tagged as "Error"
- Failed - When a notification is tagged as "Failed" this is most probably due to conditions that are mandatory from the provider that are not being met, due to which the notification execution has been tagged as "Failed"
- Bounce - Bounce is a status that would be seen only in the case of an "Email" channel. This happens when
- The email address is incorrect
- The email address requires senders to be whitelisted in their domain to receive emails.
- The email address' mailbox is full and unable to receive any more notifications.
Undelivered statuses are tracked when they are:
- Invalid-Subscriber
- Blacklist
- Rejected
- Bounce
Updated about 2 months ago